

A discrete graph might sound like a tricky math term, but it’s actually pretty simple once you break it down. In this article, we’ll explain what a discrete graph is, where you see them in everyday life, and how they’re different from other kinds of graphs. Whether you’re in school, teaching, or just curious, this fun and easy guide will help you understand this important math concept.
What Is a Discrete Graph?
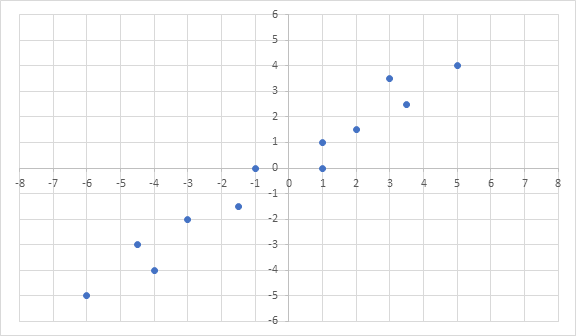
A discrete graph is a type of graph used in math where the values are separate and distinct. This means that the points on the graph do not connect with each other by lines or curves. Each point stands on its own, like dots that don’t touch.
These graphs usually represent things that can be counted, not measured. Think about things like the number of students in a classroom, the number of cookies in a jar, or how many books someone reads each month. You can’t have 3.5 kids or 2.7 cookies—only whole numbers work in this case.
In simpler words, a discrete graph helps us show countable data, where each value is clearly separated from the next. This is different from graphs that show smooth lines, which are used for things like measuring temperature or tracking distance over time.
Which Description Is Represented by a Discrete Graph?
The best description that’s represented by a discrete graph is “data that involves specific, separate values”. This usually includes whole numbers and values that don’t change smoothly. In other words, when we are counting something and not measuring, that’s when we use a discrete graph.
Here’s a simple example: If we graph the number of pets each student in a class has, we’ll have individual points for each student. One student might have 1 pet, another might have 3, and another 0. We wouldn’t draw a line between these points because there’s no in-between like 1.5 pets—that just wouldn’t make sense!
So, “which description is represented by a discrete graph?” The answer is: “situations that involve individual, countable units.”
This kind of graph is especially useful when:
- You have data you can count.
- You want to see specific values.
- You’re dealing with numbers that don’t fall between other numbers.
Real-Life Examples of Discrete Graphs
You might think discrete graphs only exist in math class, but they’re actually all around you. Here are some real-world examples that make discrete graphs easier to understand.
Counting Kids in a Classroom
Imagine you’re looking at how many kids are in each which description is represented by a discrete graph at your school. You can’t have 22.5 students. You’ll only have whole numbers like 20, 21, or 22. Each class can be shown as a single dot on a graph, and those dots won’t be connected—just like a discrete graph.
Number of Ice Creams Sold Daily
Let’s say an ice cream truck keeps track of how many ice creams they sell each day. On Monday, they sell 30. Tuesday, it’s 42. Wednesday, maybe 35. If you graph those numbers, you’ll place dots for each day. These dots won’t be connected because the amount sold each day is different and separate. That’s a classic example of a discrete graph in business.
People in Different Cars
Think about cars passing by on a street. You count how many people are in each car. One car has 1 person, another has 3, and another has 5. When you make a graph with that data, you plot each car as a point, showing how many people were inside. No lines connect the points since you’re only showing exact counts.
Discrete vs Continuous Graph – What’s the Difference?
This is a super common question: What’s the difference between discrete and continuous graphs? The answer is actually pretty simple once you know what to look for.
- Discrete Graph: The values are separate. You’ll see dots that are not connected. They show things you can count—like people, books, or ice creams.
- Continuous Graph: The values are connected. You’ll see a line or curve that runs smoothly from one point to the next. It shows things you can measure—like time, speed, temperature, or weight.
So, if you’re counting whole numbers, it’s probably a discrete graph. But if you’re tracking smooth changes over time or distance, you’re dealing with a continuous graph.
When Do We Use Discrete Graphs in Math?
We use discrete graphs in math any time we want to represent data that comes in individual units. These are things that you can’t break into smaller parts in a meaningful way. For example:
- Test scores (like 90, 85, 78 – you can’t score 78.6 in many cases)
- The number of pets in each home
- How many customers visit a store each day
Math teachers love using discrete graphs when introducing students to graphing and statistics because it helps build a strong foundation for data interpretation. It also shows clearly how many times each value happens.
Easy Ways to Spot a Discrete Graph
Want to know how to quickly tell if a graph is discrete? There are a few simple tricks you can use to figure it out fast.
Whole Numbers Only
A big sign of a discrete graph is when the values are all whole numbers. If you don’t see decimals or fractions on the graph, that’s a strong clue it’s discrete. That’s because discrete graphs only deal with things that you can count, not measure.
Gaps Between Points
In a discrete graph, the dots or points are not connected. There are gaps between each value. This is because each value stands alone. The data points don’t blend into each other like in a continuous graph.
Why Are Discrete Graphs Important?
Discrete graphs help us visualize data clearly. They’re important in school, science, business, and technology. Here’s why they matter:
- They show exact values—no guessing needed.
- They’re easy to read for beginners.
- They help us make decisions based on specific information.
- They’re used in programming, statistics, and even video game development.
Once you understand how to read and create discrete graphs, you’ll be better at spotting patterns and solving real-world problems.
Common Mistakes to Avoid
Many people mix up discrete and continuous graphs. A common mistake is drawing lines between points on a discrete graph—don’t do that! Each point is separate, and there’s no reason to connect them. Another mistake is using decimals or fractions in a discrete graph, which doesn’t make sense since we’re only dealing with countable, whole numbers.
Also, remember: if the question asks, “Which description is represented by a discrete graph?”, the answer is never going to involve smooth, connected data.
The Bottom Line
A discrete graph is one of the most useful and easy-to-understand tools in math. It shows data made up of separate, countable values, like how many books you read each month or how many people are in each room. If you see dots with spaces in between and no connecting lines, you’re probably looking at a discrete graph.
When someone asks, “Which description is represented by a discrete graph?”, now you know the answer: countable, separate data with values that don’t blend together.
By using simple examples like counting kids, ice cream sales, and people in cars, we’ve shown how discrete graphs appear in everyday life. Whether you’re a student, teacher, or just curious about how data works, understanding discrete graphs is a great step in learning how to make sense of the world around you.